Showing posts with label Meteorology. Show all posts

Monday, March 25, 2013

Installation failed...Spring on hold for now


Once again, the new working week begins as it has done so many times since mid-February with below average temperatures for the time of year. The Celtic Spring (as opposed to the meteorological or astrological season) is almost two thirds over and the Celtic summer is less than 5 weeks away but wintry conditions continue to dominate our weather.

Saturday, February 16, 2013

UK Report Studies Impacts Of Space Weather


The UK Met Office welcomes the Royal Academy of Engineering report on Space Weather, the UK's first in-depth study of the impacts of space weather.

Thursday, February 14, 2013

The Weather And The Movies


When reading a book, watching a film or even a basic TV soap opera, have you ever noticed how the actual weather plays a part in the story?

Wednesday, January 30, 2013

A Simple Guide to Decoding METARs and TAFs

The Meteo Times' Fergal Tierney writes:

METARs (METeorological Aviation Reports) and TAFs (Terminal Aerodrome Forecasts) can appear quite confusing at first glance, but after a little practice they can be decoded instantly and can be a useful tool for anybody who wants a quick idea of the present weather, and what it will do in the coming hours. They are primarily issued for aviation personnel (Pilots, Air Traffic Controllers, Airport Authorities, etc.) but can be used by anybody who knows how to decode them.

METARs

A METAR is a coded text report of the current weather conditions observed at an airport, and is issued every 30 minutes in Ireland. It gives information on wind (speed and direction), visibility, current weather, the coverage and heights of cloud layers, temperature, dewpoint, atmospheric pressure, plus in some cases, a trend forecast for the next two hours. Let's take an example from Dublin Airport.

EIDW 072100Z 35008KT 8000 -RADZ SCT002 SCT006 BKN012 03/03 Q0989 NOSIG=

Come back, don't be afraid, it's all very easy! Let's break it down:

EIDW - This is the ICAO Code for Dublin Airport.

072100Z - The first 2 digits are the date (in this case the 7th), the other digits are the time of the report, in UTC/GMT (Z is a military code for UTC). This report was issued at 2100UTC (or 9pm GMT)

36008KT - This is the average wind measured over the previous 10 minutes. The first 3 digits represent the direction (in degrees true) from which the wind is blowing. Imagine a clockface, divided into 360 divisions (degrees true). North is 0° or 360°, East is 90°, South is 180°, West is 270°, etc. A direction of say 350° means wind blowing from just west of due North. The direction will always be reported by 3 digits, so a wind from say 30° (North-northeast) would be written as 030 (and read "zero three zero"). The next 2 digits are the speed, in knots (1 knot = 1.15 mph, or 1.85 kph). So in the METAR above we have an 8kt wind blowing from roughly north (350°, "three five zero degrees"). Sometimes you will see something like 27014G29KT. The G29 part represents the highest gust recorded in the last 10 minutes, so the wind in this case would be read "Wind two seven zero degrees, one four, gusting two niner, knots". You may also see something like 310V060 following the wind group. This shows the variation in wind direction, so in this case it would read "varying between three one zero and zero six zero degrees".

8000 - This is the minimum visibility observed/measured, in metres. For visibilities of 10 km or more, only the 4 digits 9999 will be used.

-RADZ - The current weather is light rain and drizzle. Other common descriptors are RA (RAin), DZ (DriZzle), SN (SNow), RASN (Sleet, i.e. Rain and Snow), GR (Hail), GS (Graupel), TSRA (ThunderStorm with RAin), FG, (FoG), BR (Mist), MIFG (Shallow FoG), FZFG (FreeZing FoG), HZ (HaZe). A - before it means "Light", a + means "Heavy", and no quantifier means "Moderate". So +TSRA means "Thunderstorm with heavy rain", RA means "Moderate Rain", -SN means "Light Snow", etc.

SCT006 BKN012 - These represent the coverage and heights of the cloud bases. SCT (Scattered) means 3-5 oktas (eighths) of the sky is covered, BKN (Broken) means 6-7 oktas. 006 and 012 are the cloud base heights, in hundreds of feet above ground level (not sea level), therefore the METAR reports Scattered clouds at 600ft and Broken clouds at 1,200ft above ground level (agl).

Other cloud descriptors are SKC (SKy Clear), FEW (1-2 oktas) and OVC (Overcast, 8 oktas). In good weather you may see CAVOK (Ceiling And Visibility OK) replacing the visibility and cloud groups, as it means that conditions are good for flying (no significant weather, visibility of 10km or more, no clouds below 5,000ft, no Cumulonimbus (Cb) or Towering Cumulus (TuCu) clouds (which would imply strong turbulence for an aircraft)).

03/03 - The first 2 digits are the temperature, and the last two digits are the dewpoint, both in °C. Negative values are shown with an M in front, eg. M03/M06 (temperature -3°C, dewpoint -6°C).

Q0989 - This is the sea-level atmospheric pressure, in whole hectoPascals (or millibars). In this case it's 989hPa.

NOSIG - This means "NO SIGnificant change is expected within the next two hours". In some cases, where the weather is changing rapidly, this will be replaced by a trend forecast, in the same format explained in the TAF section next.

= - This signifies the end of the report.


TAFs

A TAF is a coded text forecast of the weather conditions expected within a 5 nautical mile radius of the airport over the duration of the validity period indicated. As it is only a forecast for the local area, in some cases it may not be representative of the conditions further afield, due to local topography, lakes, etc. TAFs are issued every six hours, at 0500, 1100, 1700 and 2300Z, and are valid for 24 hours from the hour following the time of issue. In Ireland, TAFs are generated by meteorologists at Shannon Airport, and this human input ensures that they are as accurate as possible, but in some cases they may be amended to reflect changes different to those forecast.

Here is an example of a TAF issued for Cork Airport.

EICK 081100Z 0812/0912 25010KT 9999 SCT018
BECMG 0812/0814 26015KT
TEMPO 0813/0820 27017G28KT SCT017CB
PROB30 TEMPO 0815/0819 5000 -SHRA SCT010 SCT017CB BKN020
BECMG 0820/0823 28008KT
BECMG 0909/0912 23007KT=

The codes are similar to the METAR codes above.

EICK - The ICAO Code for Cork Airport.

081100Z - TAF issued at 1100GMT on the 8th.

0812/0912 - TAF is valid from 1200GMT on the 8th to 1200GMT on the 9th.

25010KT - Wind is expected to be from 250 degrees (Westerly) at 10 knots.

9999 - Visibility 10 km or more.

SCT018 - Scattered clouds at 1,800ft above ground level.

BECMG 0812/0814 - BECoMinG (ie. a permanent change is expected to occur) between 1200 GMT and 1400GMT on the 8th....

26015KT - Wind from 260 degrees at 15 knots

TEMPO 0812/0820 27017G28KT SCT017CB - Between 1200GMT and 2000GMT on the 8th, it will TEMPOrarily be Wind 27017G28KT and SCT017CB (Scattered Cumulonimbus clouds at 1,800ft). "Temporarily" means "for less than half of the time period specified".

PROB30 TEMPO 0815/0819 5000 -SHRA SCT010 SCT017CB BKN020 - There is a 30% probability that temporarily between 1500GMT and 1900GMT on the 8th, visibility will reduce to 5000 metres in light rain showers, with scattered clouds at 1000ft, scattered Cumulonimbus at 1,700ft, and broken clouds at 2,000ft.

PROB30 means a slight chance. PROB40 means a medium chance. These are ways for the forecaster to show his/her confidence in this part of the forecast. PROB30 means there is a possibility that warrants a mention, but it probably won't happen. PROB40 means it's more likely to happen, but it's still not certain. If they wrote BECMG, they would be fully confident that the change would occur.

BECMG 0820/0823 28008KT - Wind changing to 28008KT some time between 2000GMT and 2300GMT on the 8th

BECMG 0909/0912 23007KT= - Wind changing to 23007KT some time between 0900GMT and 1200GMT on the 9th. End of TAF.


This is a good site for viewing the latest METARs and TAFs in both coded and decoded format. Click on each airport. With a little practice, you will be able to read through each report without needing to consult the decoded text on the right.

This site gives the latest METARs and TAFs (undecoded) for Europe and North Africa, overlayed on the latest IR satellite picture.

Fergal Tierney is an Applied Physics and Chemistry graduate and holds a Private Pilot's Licence.

Monday, January 14, 2013

How Snow Is Formed


Snow is formed when temperatures are low and there is moisture - in the form of tiny ice crystals - in the atmosphere. When these tiny ice crystals collide they stick together in clouds to become snowflakes. If enough ice crystals stick together, they'll become heavy enough to fall to the ground.

How cold does it have to be to snow?

Precipitation falls as snow when the air temperature is below 2 °C. It is a myth that it needs to be below zero to snow. In fact, in this country, the heaviest snow falls tend to occur when the air temperature is between zero and 2 °C. The falling snow does begin to melt as soon as the temperature rises above freezing, but as the melting process begins, the air around the snowflake is cooled.

If the temperature is warmer than 2 °C then the snowflake will melt and fall as sleet rather than snow, and if it's warmer still, it will be rain.

'Wet' snow vs. 'dry' snow

The size and make up of a snowflake depends on how many ice crystals group together and this will be determined by air temperatures. Snowflakes that fall through dry, cool air will be small, powdery snowflakes that don't stick together. This 'dry' snow is ideal for snow sports but is more likely to drift in windy weather.

When the temperature is slightly warmer than 0 °C, the snowflakes will melt around the edges and stick together to become big, heavy flakes. This creates 'wet' snow which sticks together easily and is good for making snow men.

Snowflakes

Snowflakes are collections of ice crystals that can occur in an infinite variety of shapes and forms - including prisms, hexagonal plates or stars. Every snowflake is unique, but because they join together in a hexagonal structure they always have six sides.

At very low temperatures snowflakes are small and their structure is simple. At higher temperatures the individual flakes may be composed of a very large number of ice crystals - making a complex star shape - and can have a diameter of several inches.


SNOWFALL IN IRELAND


- Due to its geographical location and exposure to Polar air streams, Donegal is Ireland’s snowiest county on average. In contrast, southern and southeastern coastal counties experience the least snow.

- One of the heaviest snowfalls ever recorded in Ireland occurred not in winter, but in mid-Spring, when up to 2 foot of snow fell in parts of Connacht and north Munster in the space of a few hours on the 1st April 1917.

- The winter of 1946-1947 is probably the snowiest winter on record in Ireland and although the winter of 62-63 was infamously cold, relatively little snow was recorded overall during that season.

- Although January 1982 is famed for bringing heavy snowfalls along parts of the east coast, less documented is the fact that equally heavy and disruptive snowfalls affected many parts of Ulster, Connacht and north Leinster during the previous month (December 1981)

- Based on Met Eireann data, the number of days with observed falling and lying snow in Ireland has decreased by around 10% since 1961.

Info c/o The Meteo Times/UKMO

Monday, September 24, 2012

Peter O'Donnell's Winter 2012-13 Forecast Summary

 
Based on my usual methodology and a consideration of the unusual ice-free anomaly expected to start the season, the following is my expected temperature and precipitation trend for DEC-JAN-FEB (following a November with expected mild temperatures 1-2 C deg above average, and near normal in precipitation ... October expected to be near normal for temperature and somewhat on the wet side of normal).

DECEMBER looks fairly close to normal (on the whole) with a roughly equal mixture of mild and cold days. There may be one relatively severe cold spell of 2-4 days around the middle of the month towards the 20th. This might not produce much snow as it could be a shallow incursion but some snow would be likely given the temperature anomalies indicating below zero temperatures briefly. Before that, the period 7th to 13th is expected to be quite mild (highs could reach 11-13 C), and the run up to Christmas increasingly mild with rain replacing any earlier sleet or snow in most areas but there would be a better chance for snow in north-central parts of Britain around Christmas. A stormy interval may develop just around or after Christmas Day. Numerical index values suggest a windy day on the 26th so there's one specific daily forecast to test out. 
 
JANUARY looks relatively mild but with severe cold forming gradually off to the north and east of Ireland and the U.K., some intervals of modified cold could intrude, perhaps less forcefully in south and west regions of Ireland. The month may also become rather stormy at times especially in periods around the 10th and 25th. Some damaging winds would not surprise me given the developing thermal gradient across the Atlantic and a likely very strong zonal jet stream at times. A trend to much colder weather getting closer to Britain at least is likely near the end of the month although mild weather could hold on in Ireland and the southwest parts of England.

FEBRUARY is expected to be much colder than average by 1.5 to 3.5 degrees with considerable snow or sleet and frequent easterly winds. This will develop because of massive blocking to the north of Ireland and the U.K. extending from Iceland to Scandinavia. There is some indication of a very severe period of wintry weather. This severe cold may last some time beyond the end of the month.

I may update this seasonal forecast if I have any further results from ongoing research, but this is the output of the current research model with some consideration given to the ice anomaly. I suspect it will intensify the pattern that would have existed otherwise, so I have tended to amplify the numerical output on either side of normal. Once severe cold is established over snow cover it is hard to dislodge during the depth of winter, but would also warn that February is the least reliable of the three monthly forecasts not only because it's further out but also because it is more anomalous.

Peter O'Donnell is a Vancouver-based climatologist who specialises in providing long-range forecasts for Ireland and Britain.

Friday, September 7, 2012

New Chairman For UK Met Office

The new non-Executive Chair of the Met Office, Greg Clarke, will take up his post this month, following the announcement of his appointment by Business Minister Norman Lamb in August. 

Thursday, September 6, 2012

Euro Weather Satellite To Launch From Kazakhstan

Metop-B, the European polar orbiting weather satellite designed and manufactured by Astrium is now ready to launch from the Baikonur cosmodrome in Kazakhstan. 

Friday, August 24, 2012

How The Sun Could Control Earth's Temperature

Stephen Wilde (biography below) presents "Stephen Wilde’s New Climate Model".  In this first feature article, Stephen examines  "How The Sun Could Control Earth's Temperature". 


Thursday, August 23, 2012

Sightings Of Fireball Reported Across Leinster


Astronomy Ireland has confirmed to The Meteo Times (TMT) that it has received some reports of a fireball or particularly bright meteor spotted last night (Wednesday) over Leinster. 

Sunday, August 19, 2012

Atmospheric Pressure And Pressure Levels Explained


If you are a regular visitor to this site then you have probably heard many references to terms such as the "850hPa temperatures" or "500hPa troughs" and wondered what exactly they mean, The Meteo Times' synoptics forecaster Fergal Tierney writes.

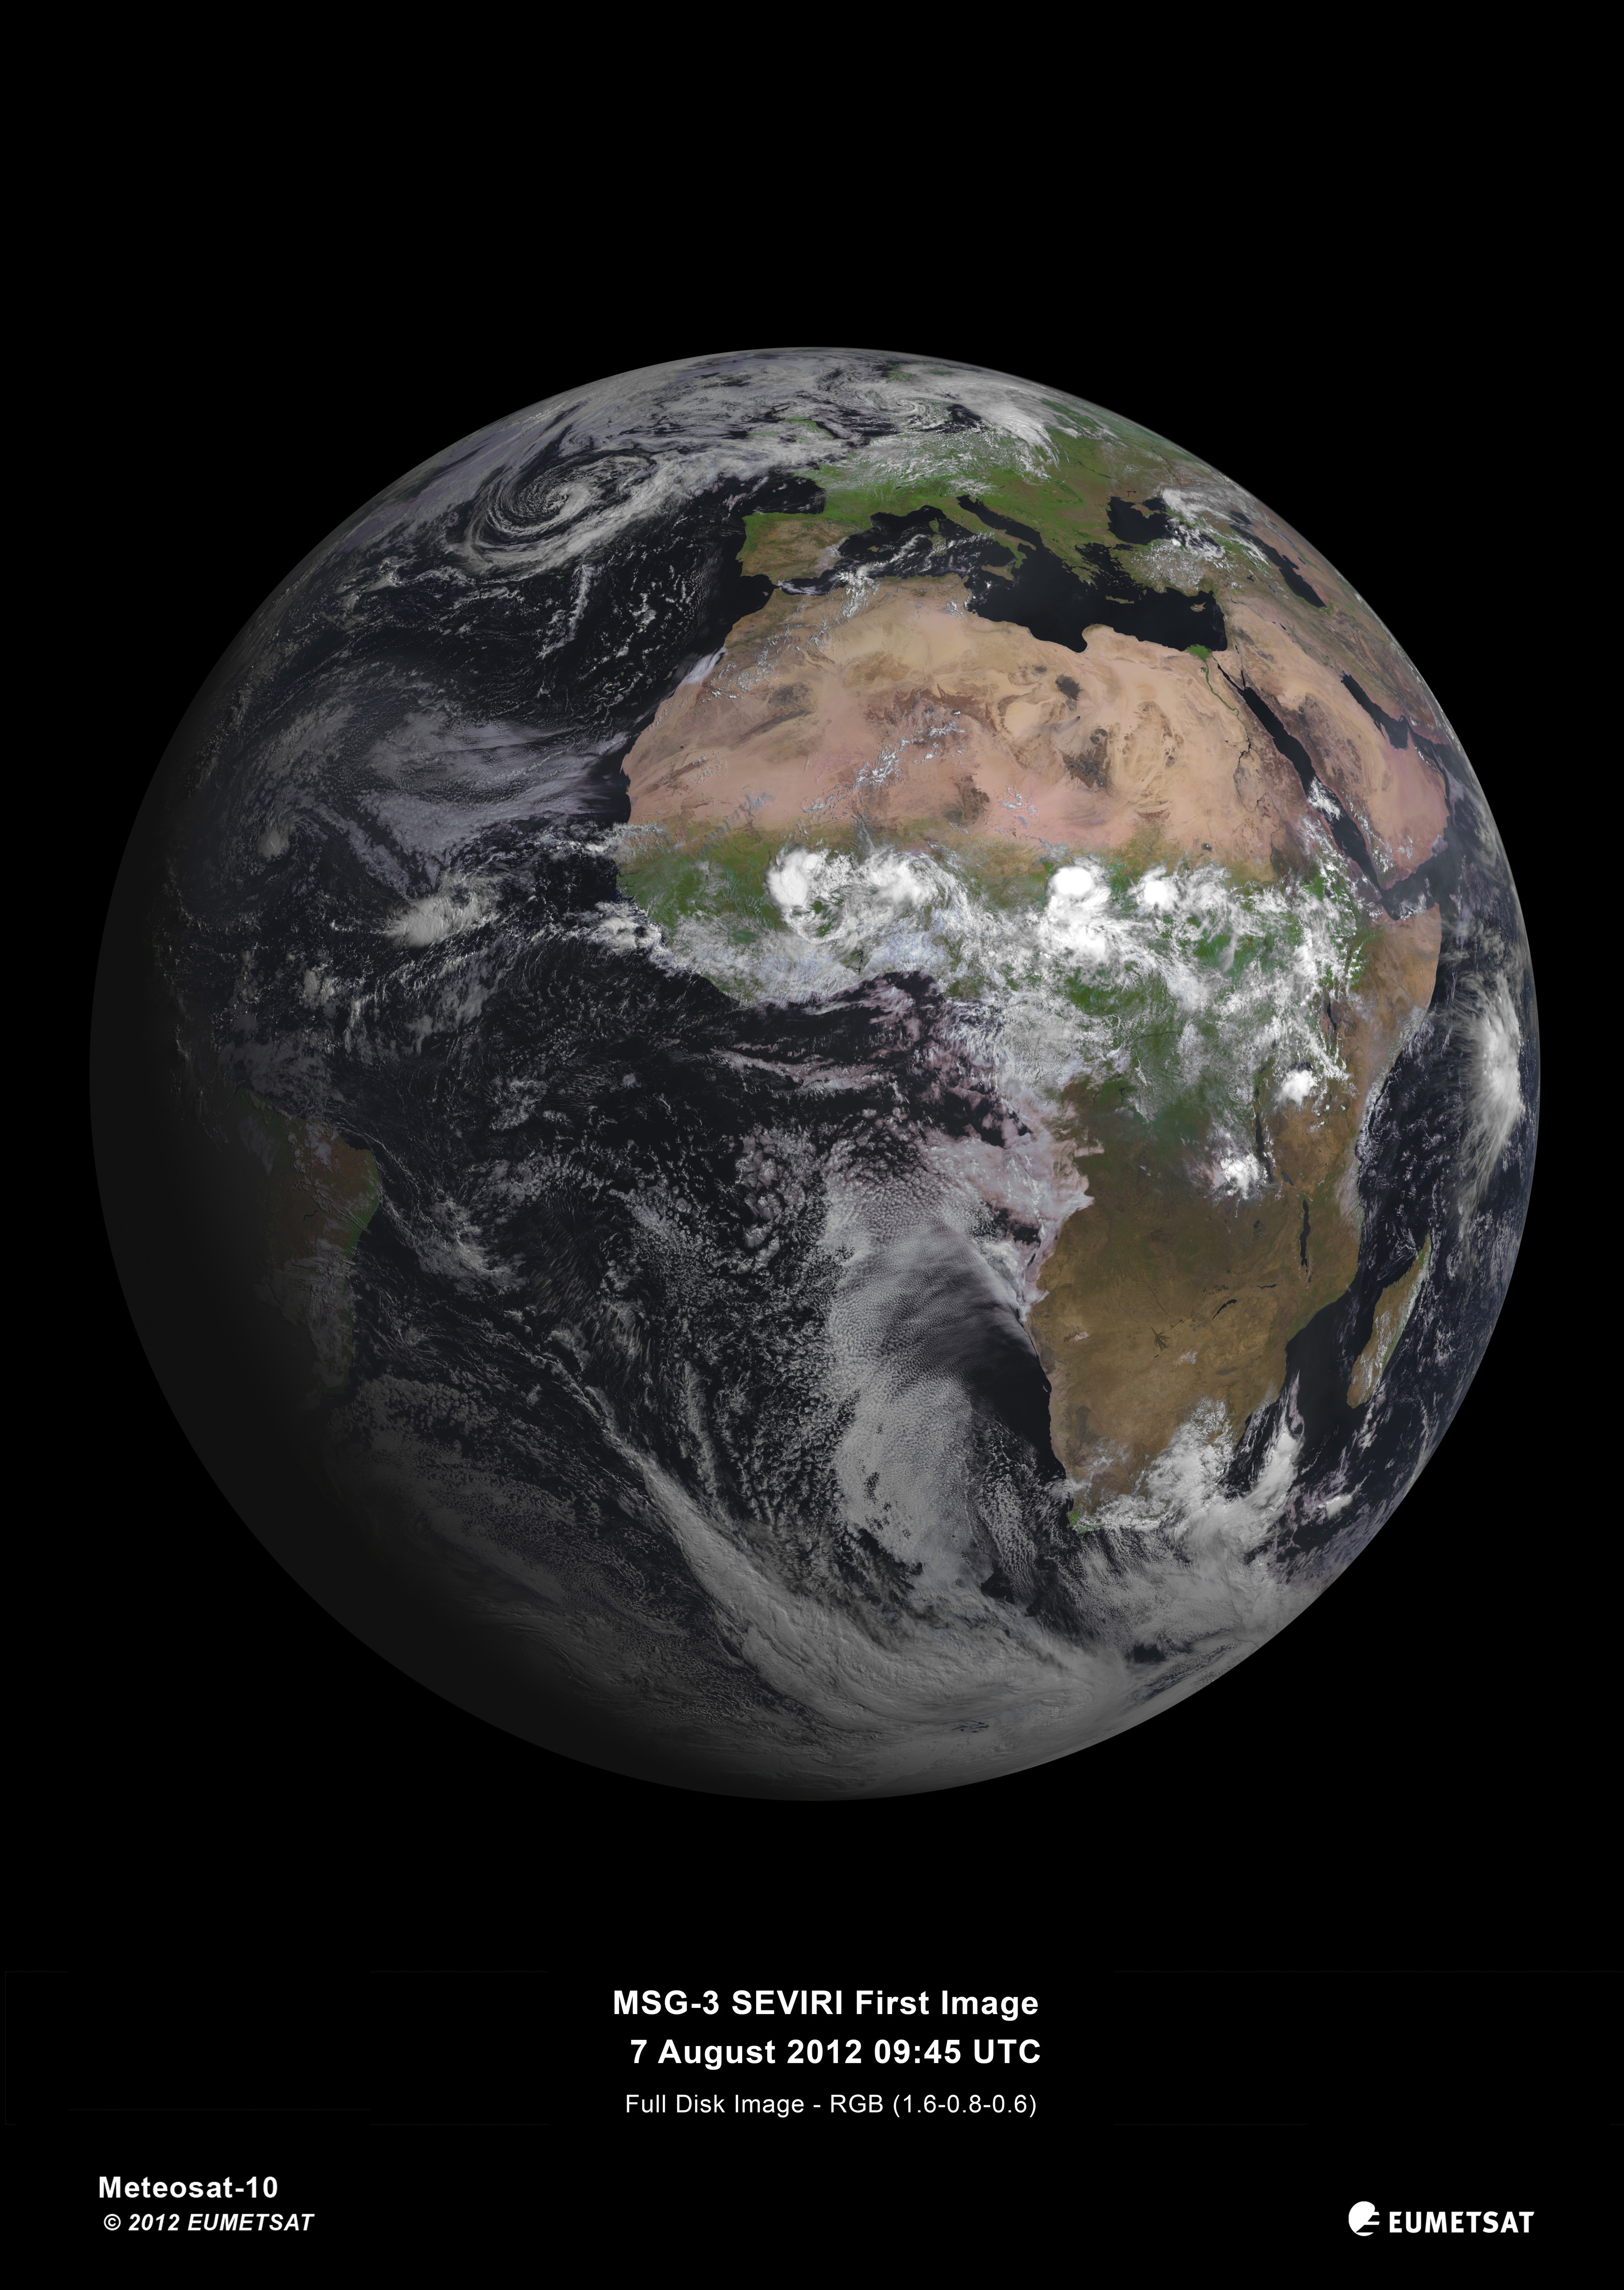
Weather Satellite Delivers Stunning First Shot Of Earth

Click on the image for a larger view.
The Spinning Enhanced Visible and Infrared Imager (SEVIRI) instrument on MSG-3 has captured its first image of the Earth.

NASA Tracks Electron Beams From The Sun

NASA's Advanced Composition Explorer (ACE) observes a wide array of particles that flow toward Earth from the sun to better understand the great space weather system that connects the sun to our planet. Credit: NASA/H. ZelL. 

Monday, August 13, 2012

WSI Raises 2012 Atlantic Hurricane Season Forecast


In its updated tropical forecast for 2012, WSI (Weather Services International) has increased the 2012 forecast to 13 named storms, 6 hurricanes and 3 intense hurricanes (category 3 or greater). 

Met Éireann Website Goes Mobile

Met Éireann have developed a new web app / mobile site specifically tailored for smart phones, available at m.met.ie.

How Atlantic Depressions Form

Fergal Tierney writes:

Depressions / Lows / Cyclones - there are many names used to describe the kind of unsettled Atlantic weather systems we get in Ireland, but they all mean the same thing - an area of low atmospheric pressure, bringing wet and windy weather. But how do they form? 


Firstly, it may be of help to review the articles on Atmospheric Pressure and Pressure Levels and Airmasses. Depressions normally form along what is called the Polar Front, the boundary between warm, humid tropical airmasses from the south and cold, dry polar airmasses from the north. There is a marked temperature difference (or temperature gradient) along this front, not only at the surface but also extending throughout the whole depth of the troposphere, up as far as the stratosphere. The presence of this temperature gradient in the upper troposphere is what causes the Jetstream, a fast moving westerly wind that meanders around the globe between around 40 - 70° North and South, and at an altitude of around 30,000 - 40,000ft. In wintertime, the average location of the jetstream shifts equatorward, and in summertime it shifts poleward. The jetstreams strength and direction is not constant, however, meandering north and southwards in places, and varying in strength from between 0 - 250mph. This variation can be seen in an upper chart as a series of Troughs (southward-pointing kinks containing cold air and hence low geopotential heights) and Ridges (northward-pointing kinks containing warm air and high geopotential heights), forming a series of so-called Rossby Waves around the globe.


We can see that the jetstream flows southeastwards along the western flank (edge) of a trough, curves around the base of it, and then flows northeastwards along its eastern flank, up along the western flank of the neighbouring ridge. It then flows over the top of this ridge and back down southeastwards on its eastern flank. This pattern repeats around the globe (though in some cases the jetstream may become detached or split and flow in two directions, or even dissapear completely in some areas).

Areas where the jetstream is strongest are referred to as Jetstreaks, as shown below. These jetstreaks are key factors in the formation of surface low pressure systems. Jetstreaks are divided into four regions, or Quadrants, as illustrated. Both the Left Front Quadrant (LFQ) and the Right Rear Quadrant (RRQ) are areas where the upper level flow is spreading apart, or diverging. This upper divergence causes a "void" to develop at the top of the atmosphere, and air from below must rise and "fill this void". In turn, air at the surface must converge and rise in order for this compensation to occur, a bit like a vacuum cleaner, although the speed of this rising motion is only in the order of cms/second. This rising motion causes condensation to occur, leading to clouds and precipitation. This divergence/convergence process is called Quasi-geostrophic (QG) Forcing, and causes the pressure at the surface to drop. The stronger the upper divergence, the stronger the surface convergence, and faster the drop in pressure. This is one reason why depressions are stronger in winter than they are in summer, as the wintertime jetstream is a lot stronger due to a stronger temperature gradient along the Polar Front. Another reason is due to the cold polar airmasses over relatively warm seas.

10th November 2010. Storm Carmen develops in the western Atlantic, underneath the Left Front Quadrant of a strong 80 m/s (180 mph) jetstreak east of New Foundland. Yellow lines are isotachs (lines of equal speed), in m/s. Base image from Satreponline.org

An average depression has a lifetime of around 5 days. On a surface synoptic chart it starts off as a kink in the polar front, as shown in (A) below. As it deepens, it starts to circulate around this kink (anticlockwise in the northern hemisphere, clockwise in the southern hemisphere) and forms a closed circulation centre. To the east of the centre, warm air flows northwards, marking the Warm Front. To the west, cold air flows southwards, marking the Cold Front, as in (B). As the upper divergence continues to cause the pressure to drop, the circulation tightens and the windspeeds increase. The cold front moves southeastwards and starts to catch up with the slower-moving warm front. Eventually it catches and starts to undercut under the warm front, lifting it off the surface. This process is called Occlusion, and marks the peak stage of the depression's life, (C). After occlusion has started, the pressure usually stops falling, and the depression will start moving to the left and slow down. It will have done its primary job of dispersing the strong temperature gradient along the polar front (D). It will start to fill, and may even set the scene for one or more new lows to develop, possibly leading to a Family of Lows.

Stages of a Surface Depression

As with most things in weather, things don't always go as smoothly as this in reality, but you now have a general idea of how one of our more common (but probably more unwelcome, especially in the summer) vistors works. Depressions can, as the name implies, be depressing, and lead to seemingly endless spells of unsettled weather, like in the recent wet summers, which were due to the jetstream taking up a more southerly position than normal. They can give abundant rainfall, as in November 2009, or strong winds, as in early November 2010, but they are also the reason why we live in an Emerald Isle, and do not suffer from the serious droughts of other countries.

Friday, August 10, 2012

Better Weather Warnings Needed In Sri Lanka

Little warning before flooding hit Polonnaruwa District in February 2011. Photo: Amantha Perera/IRIN.
Before he leaves to meet with farmers, R M P Karunarathne, the irrigation engineer in Sri Lanka’s north central Pollonarauwa District, calls the national Meteorological Department in the capital, Colombo, to get the weather forecast. 

Thursday, February 23, 2012

How Weather Affects Your Golf Shots

Golfers probably have more excuses when it comes to playing badly than most other sports, and weather features highly in these. 

Saturday, November 12, 2011

WSI Issues USA Winter Forecast


WSI (Weather Services International) expects the upcoming period (November-January) to average cooler than normal in all of the northern and eastern US, with above-normal temperatures confined to the southwestern and south-central US. The WSI seasonal outlooks now reference a standard 30-year normal (1981-2010).

“While most of the major climate signals, including ocean temperatures in the major Northern Hemispheric basins and in the tropical Pacific, are again suggesting a cold winter, there are numerous indications that the cold will not be as extreme as it was during the last two winters,” said WSI Chief Meteorologist Dr. Todd Crawford. 

“The current state of the oceans are almost identical to that observed in October 2008, which was only a moderately cold winter. Further, we have finally emerged from the unusually long lull in solar activity that likely contributed to the extreme nature of recent winters. Lastly, the multi-year tendency towards North Atlantic atmospheric blocking has already waned a bit in 2011, relative to the previous three years. This indicates that the atmosphere is likely regressing back to the mean a bit from the recent and persistent anomalous state. So, while we do expect another cold winter across much of the northern US, we think that the winter will be much closer to 2008-09 than 2010-11. Further, we think that the worst of the cold across the northern and eastern US will be in December and January, and that the back-half of winter could be significantly milder. In total, our forecast calls for a 6% reduction in heating demand relative to last winter, but a 5% increase relative to the 1981-2010 averages”

In November, WSI sees the monthly breakdown as:
Northeast* – Colder than normal
Southeast * – Colder than normal
N Central* – Warmer than normal
S Central* – Warmer than normal
Northwest* – Warmer than normal
Southwest* – Warmer than normal

According to Chris Kostas, Senior Power and Gas Analyst at ESAI, “In November, the heating season will begin in earnest east of the Mississippi. With above-normal heating demand expected, withdrawal rates from natural gas storage are likely to run above normal in the Consuming East (currently 1% below both last year’s level and the 5-year average). 

Production is growing quickly in the Marcellus Shale region (particularly northeastern Pennsylvania), however. This year-over-year incremental increase in regional supply will partially offset weather-related demand for stored natural gas. On balance, we believe November natural gas prices are likely to firm from current depressed Nymex levels (the November Nymex contract has averaged around $3.60/MMBtu through the first three weeks of October). Power prices and implied market heat rates in the South and Northeast (including PJM, NY and New England) are also likely to get a boost from the colder-than-normal temperatures. Milder weather west of the Mississippi will offset some of the increased gas demand from the East, and western gas basis prices (along with implied market heat rates) are expected to be relatively soft. This should translate into subdued power prices and volatility in ERCOT and California.”

In December, WSI forecasts:
Northeast – Colder than normal north & warmer than normal south
Southeast – Warmer than normal
N Central – Colder than normal
S Central – Warmer than normal
Northwest – Colder than normal
Southwest – Warmer than normal, except California

Kostas further noted, “In December, colder-than-normal temperatures across the northern tier of the U.S. should continue the above-normal heating demand in the Consuming East that began in November. Some of the increased demand from the Mid-West should be offset by the slightly warmer-than-normal temperatures that are expected throughout the South and along the East Coast, however. The Northwest and West Coast are also expected to be cooler than normal. This will boost the relatively soft western basis prices expected in November. Historically, a colder-than-normal December translates into firm Henry Hub prices. As a result, we expect natural gas prices will continue the uptrend that is likely to begin in November. Power prices in Northeast markets should be supported by the colder-than-normal temperatures as well, while slightly warmer-than-normal temperatures in Texas and Florida should provide for moderate power prices in those markets.”

In January, WSI forecasts:
Northeast – Colder than normal
Southeast – Warmer than normal
N Central – Colder than normal
S Central – Warmer than normal
Northwest – Colder than normal
Southwest – Warmer than normal

Kostas added, “In January, much colder-than-normal temperatures in the Midwest could combine with the new Cross-State Air Pollution Rule to push western PJM power prices (including Chicago) higher. Newly defined limits on coal-fired generators’ emissions are likely to reduce some coal-fired power generation in the Midwest, which supports implied market heat rates and power prices. The increase in demand from gas-fired generators and the colder-than-normal temperatures will support gas prices. Despite increased supplies from Marcellus Shale and rapidly increasing drilling activity (e.g., the Baker Hughes rig count hit a 9-month high in October), natural gas inventories are likely to draw down rapidly in January. Though much of the increased demand expected in the North will be offset by warmer-than-normal temperatures in the South and California, the trend toward higher gas prices that we believe will begin in November could continue into January.”

WSI will issue its next seasonal outlook, including the final forecast for winter (December-February), on November 22. 

To view the map defining WSI’s US regions, click here.

Weather Satellite Sends Back First Data


Eleven days after its launch into Earth orbit, the new satellite known as NPP sent back its first science data on November 8, 2011, part of a series of instrument startups and checkouts that will take place before the satellite goes into full operational mode. 

The National Polar-orbiting Operational Environmental Satellite System Preparatory Project (NPP) carries five instruments that will improve day-to-day weather forecasting while extending the record of many long-term observations of Earth's climate.

This image from the Advanced Technology Microwave Sounder (ATMS) depicts the location and abundance of water vapor in the lower atmosphere, from the surface to 5 kilometers altitude. Reds depict areas with less water vapor, while blues represent abundant water in all phases (vapor, clouds, and precipitation) in low and middle latitudes. In the polar regions, blue depicts surface snow and ice. Note that Tropical Storm Sean is visible as a blue patch in the Atlantic Ocean off the southeastern United States. 

ATMS sends and receives 22 channels, or frequencies, of radio waves. Five water vapor channels, combined with other temperature sounding channels, help scientists make a vertical profile of water vapor in the atmosphere. The measurement in degrees Kelvin (K) is not a physical temperature, but instead a measurement of the brightness and intensity of the microwave radiation. 

“Water vapor is a fuel for weather formation and is the source for precipitation,” said Fuzhong Weng, chief of the Satellite Climatology and Meteorology Division at the National Oceanic and Atmospheric Administration's Center for Satellite Applications and Research. “Water vapor distribution in space and time is a critical measurement for improving global weather forecasts. With detailed information in the vertical direction, forecasters can better identify the transport of water vapor associated with jet streams, which can fuel severe weather events. Computer forecast models can ingest the data through the analysis system and produce much better forecasts.” 

NPP serves as a bridge mission between NASA's Earth Observing System (EOS) of satellites and the next-generation Joint Polar Satellite System, a National Oceanic and Atmospheric Administration (NOAA) program that will also collect weather and climate data. Image processing by NOAA/Center for Satellite Applications and Research. 

Caption by Michael Carlowicz. Instrument: Model